

AOpartners SPOT Analytics® (Single point of truth)
Complete Operational Visibility Deployed in Weeks, not Months.
Analytics consolidates data from ERPs, cloud applications, flat files, and legacy systems into a single governed warehouse. AI-driven pipeline construction eliminates the manual engineering that typically consumes the majority of project timelines.
talk to our team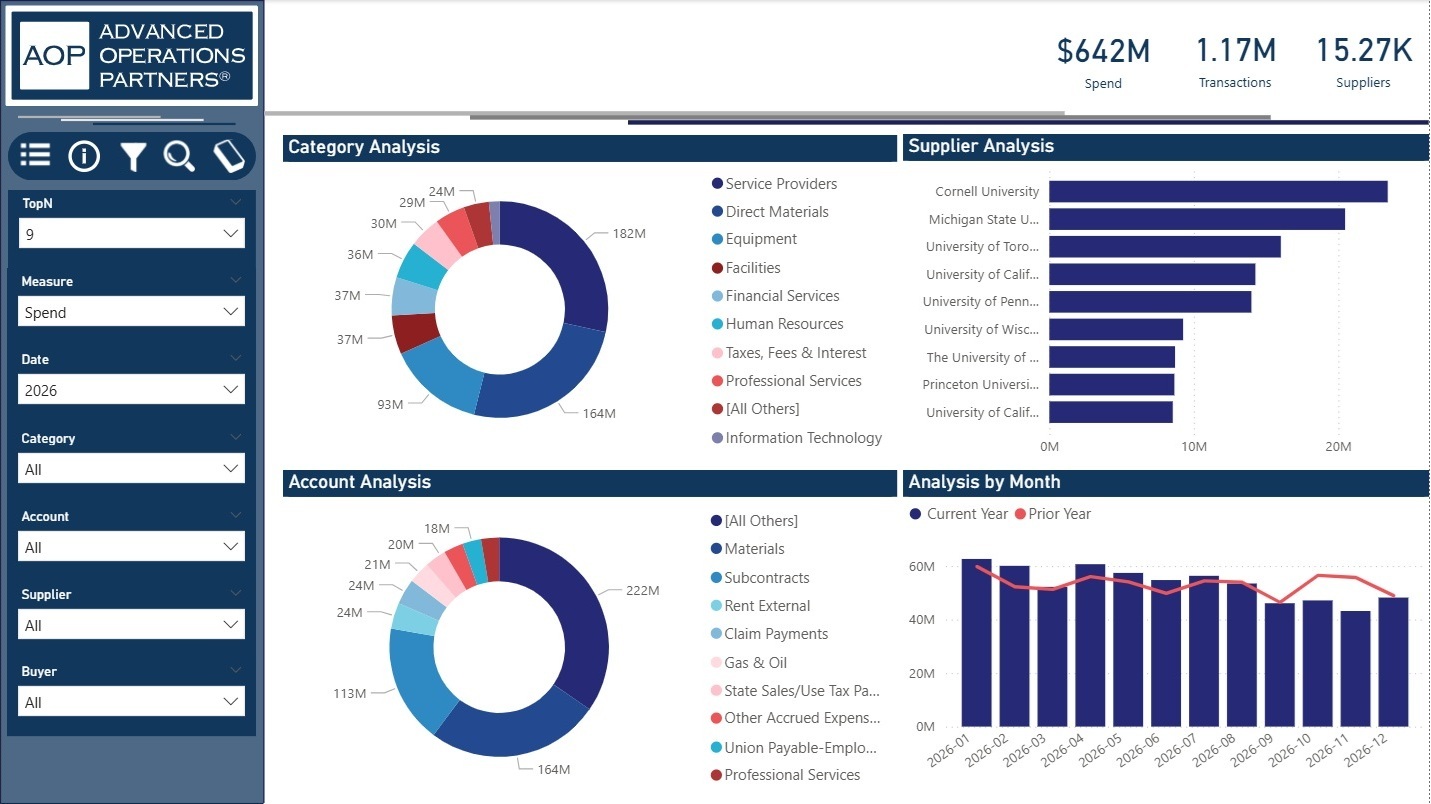
How We Structure Data Management
Analytics consolidates data from ERPs, cloud applications, flat files, and legacy systems into a single governed warehouse. AI-driven pipeline construction eliminates the manual engineering that typically consumes the majority of project timelines.
traditional approach
Manual Pipeline Construction
Every source system requires hand coded ETL, custom extraction logic, transformation rules, quality checks, refresh scheduling, and end-to-end testing. Built from scratch each time.
60-75%
of project timeline on technical plumbing
With spot analytics®
Auto Constructed Pipelines
Our proprietary AI evaluates each source's structure, data types, and patterns, then auto constructs the complete pipeline: database structures, transformations, quality checks, and refresh scheduling.
15-25%
of project timeline on technical work
How It Works
Deploy the Warehouse Template
AI Evaluates Each Source Individually
Pipelines Auto Constructed
Refreshable Execution on Schedule
Establish KPIs and Monitor Results
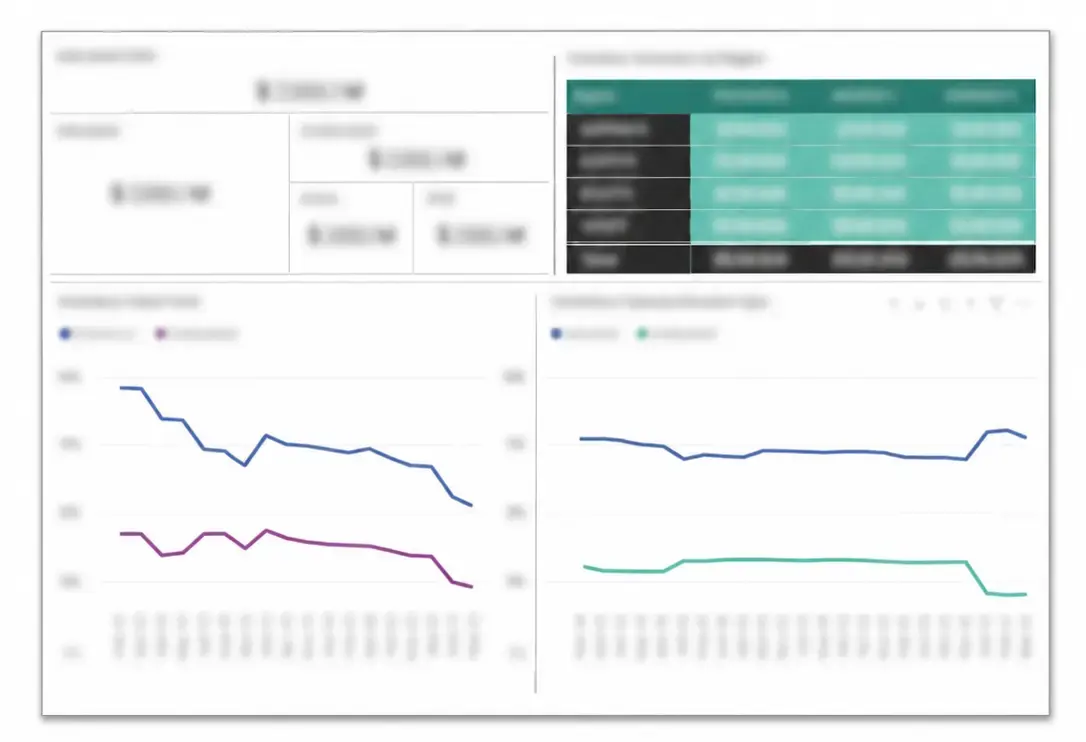
SPOT Analytics® Case Studies
Attachment Rate — Determine year-over-year consumable pull-through dollars
Issues
- Forecasting YoY consumable sales linked to a device purchase was challenging with existing sales reports
- Customers not utilizing their device's full potential could not be identified
Solution
- Deployed the Digital Warehouse template to quickly build a central data warehouse
- Developed data flows to capture daily sales, item, and customer information
- Calculated attachment rate of consumables sales linked to individual devices by items, types & segments
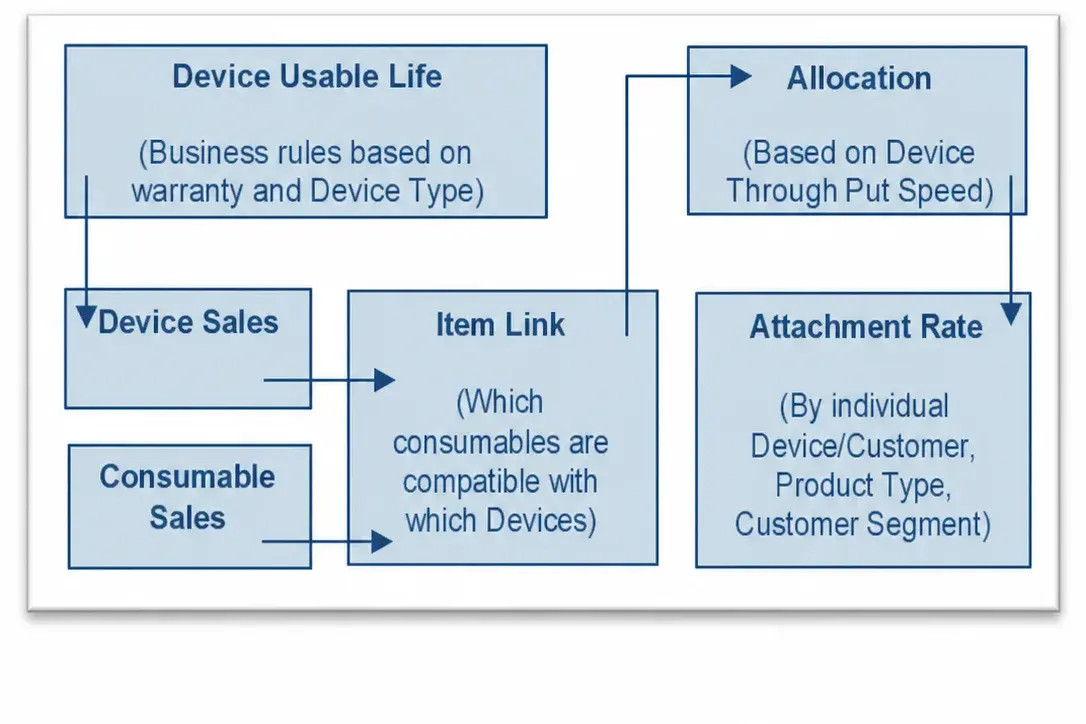
Understanding consumable attachment rates allowed the sales team to identify and target customers with additional sales potential.
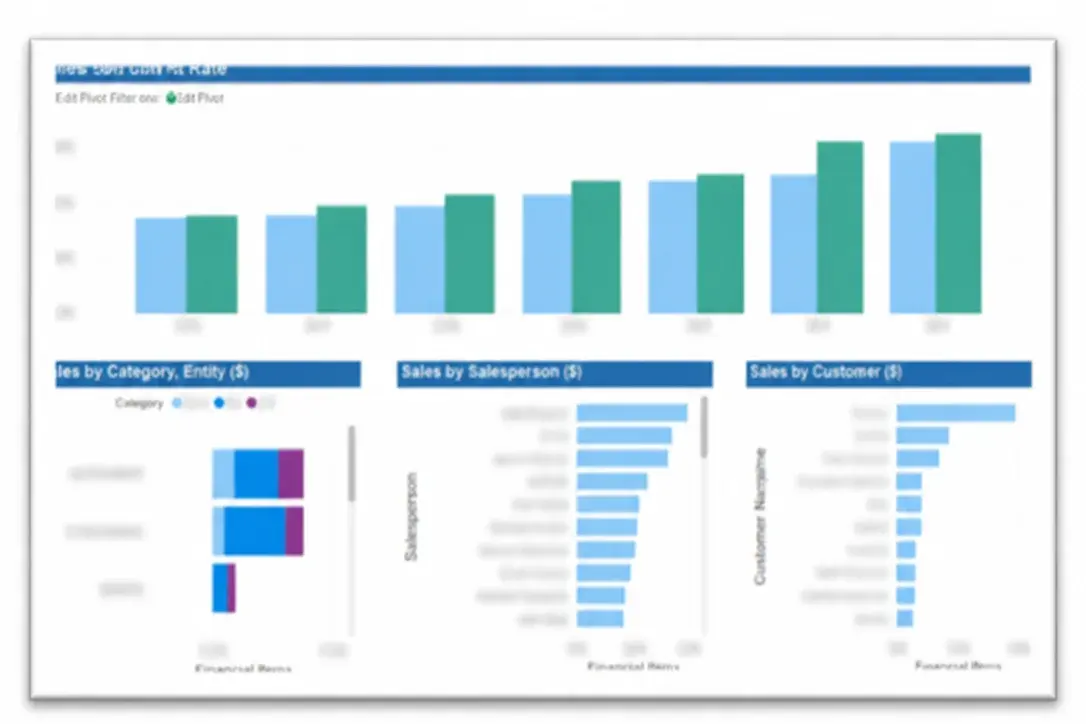
Operations — Gain visibility into key business drivers across multiple operational areas
Issue
- Inefficiencies and irregularity in collecting and assembling data caused delayed decision-making and delayed the impact analysis of those decisions
Solution
- Developed a central warehouse adding structure, repeatability & governance to the data management process
- Established 42 KPIs to monitor performance around People, Service, Quality, Cost, Financials, Production & EHS
- Developed data flows to capture daily transactions, greatly improving visibility into core performance indicators
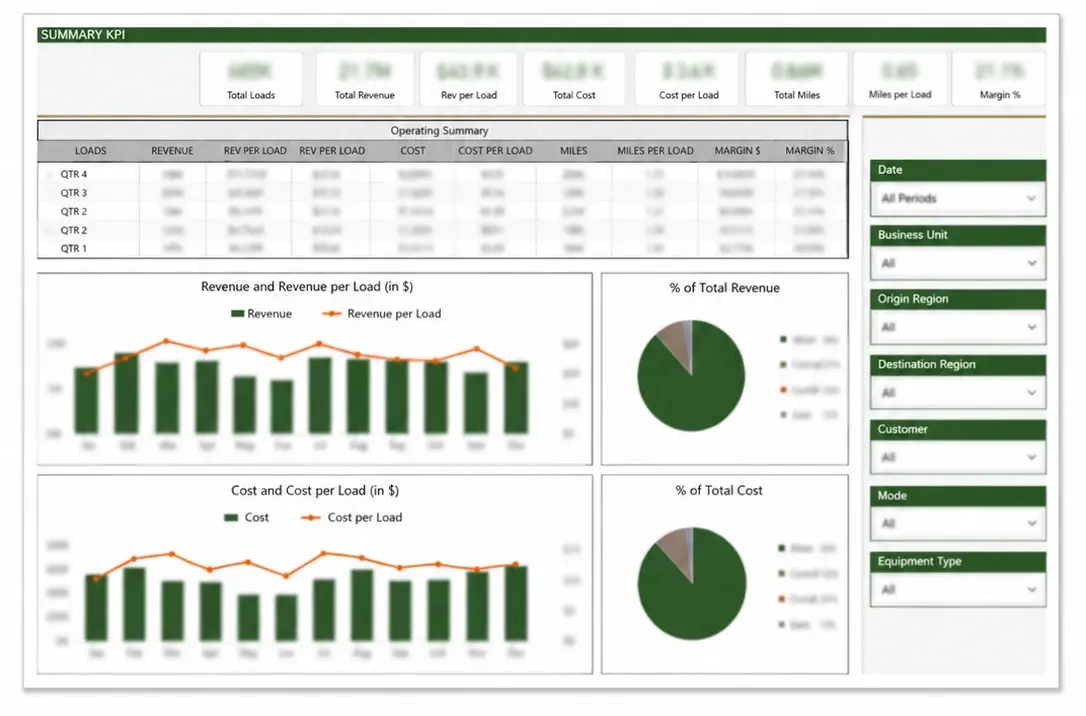
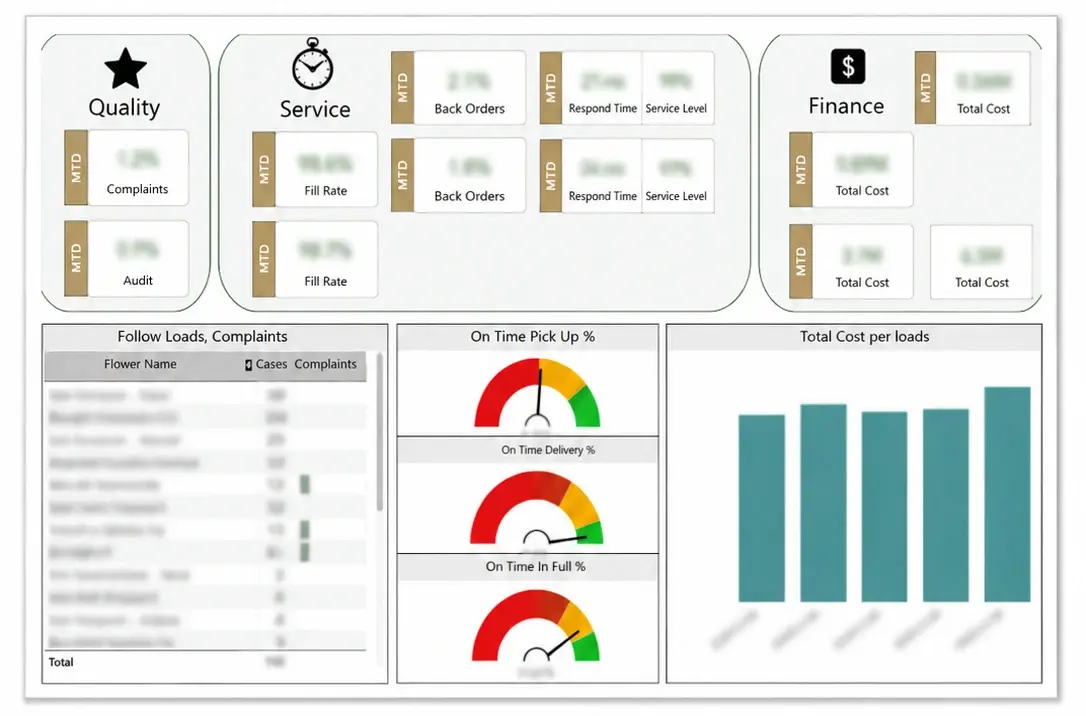
Daily monitoring provided better visibility into multiple organization-wide workstreams.
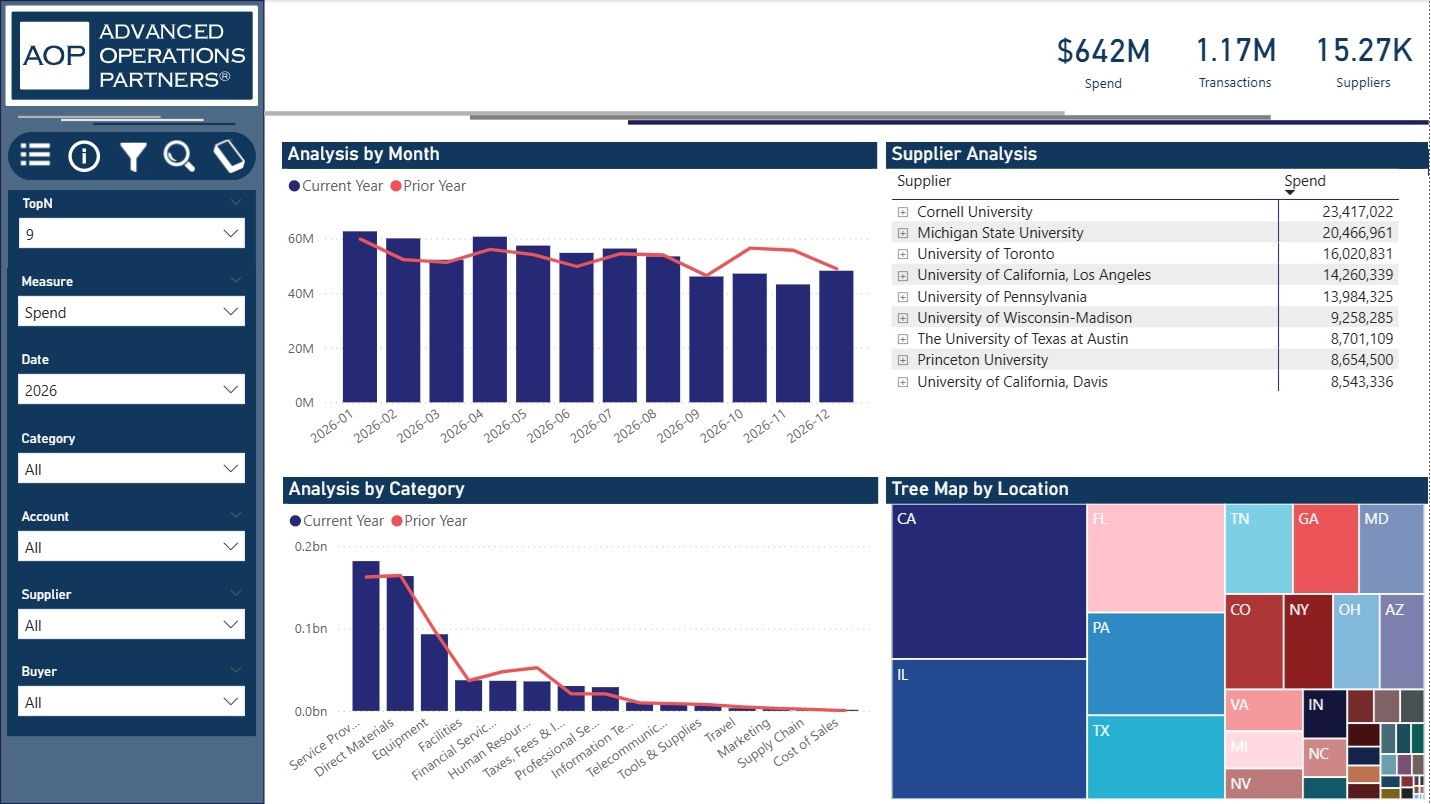
Spend Cube — Determine spending trends and key drivers of cost across the organization
Issue
- With recent acquisitions, there was no unified reporting across all procurement teams
- The customer had already invested in a third-party data warehouse tool
Solution
- Leveraging the SPOT Analytics process, data was consolidated from all ERP sources and fed into the third-party data warehouse tool
- Transactions were categorized into a procurement-facing hierarchy
- The resulting reports identified actionable opportunities, reduced waste, consolidated vendors, and improved purchasing efficiency
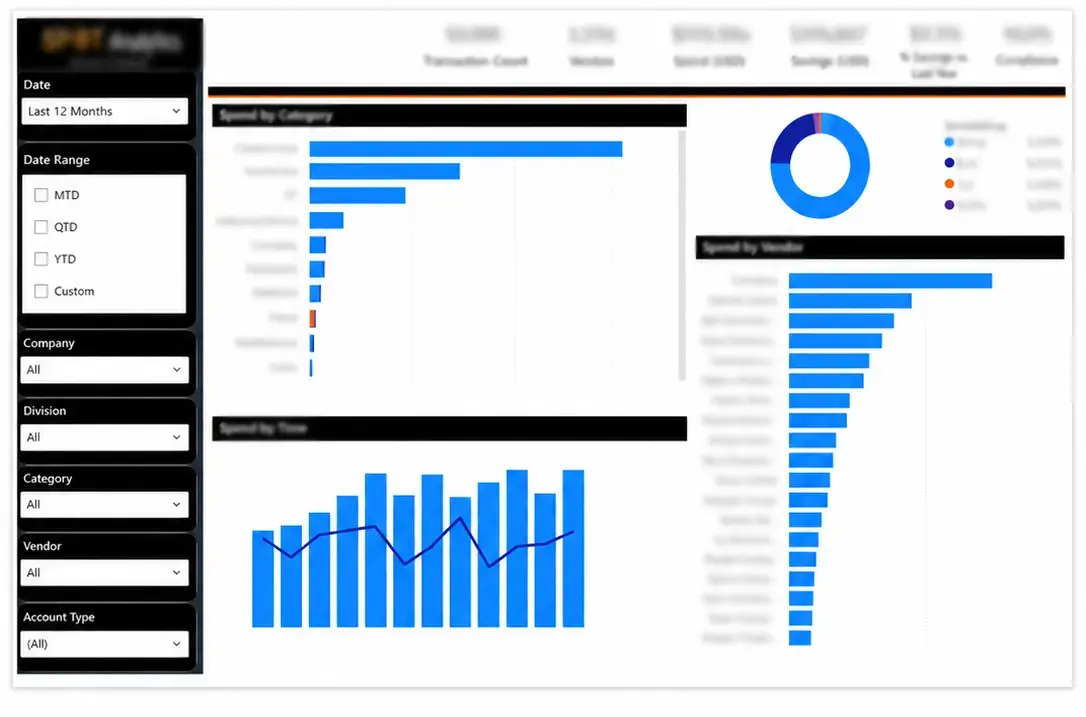
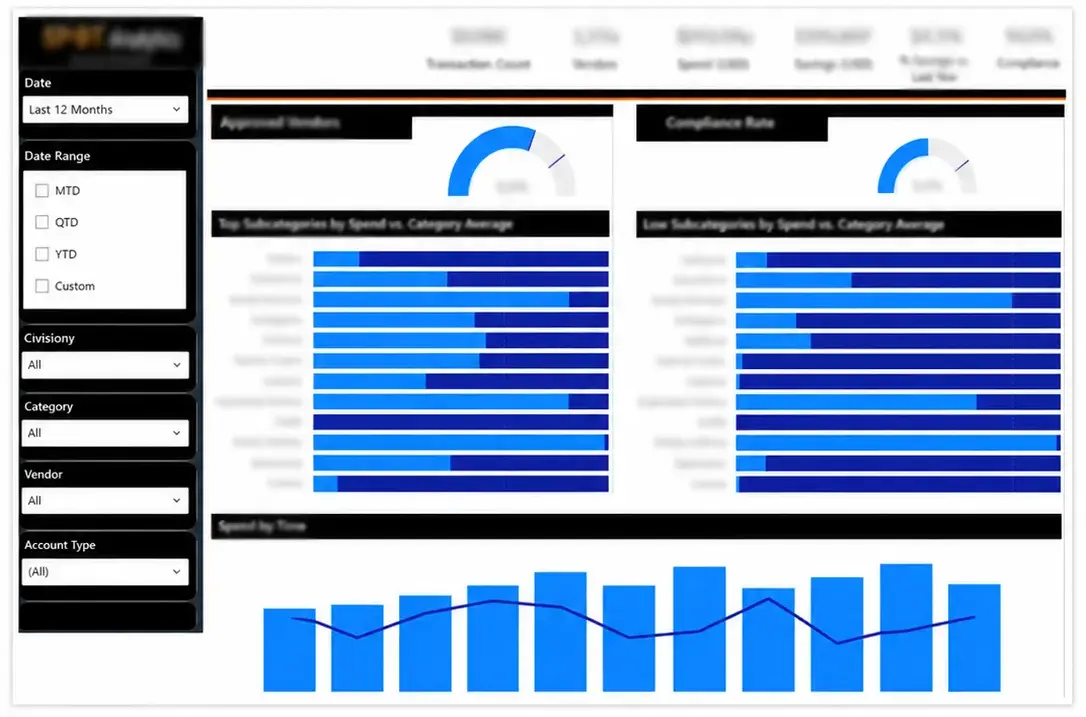
Grouping all spend into a unified category structure and identifying shared vendors provided item simplification and sourcing opportunities.
Inventory — Reduce on-hand inventory value
Issues
- COVID-19 supply chain disruptions caused buyers to pull purchases forward in anticipation of increased lead times
- Over-purchasing caused the value of inventory on hand to grow by over 50%
Solution
- Leveraged the Digital Warehouse template to quickly deploy a central data warehouse
- Developed data flows to capture daily inventory snapshots from all divisions
- Created KPIs and dashboards to monitor inventory levels and drive buyer behavior
- Reduced on-hand inventory value by $53M
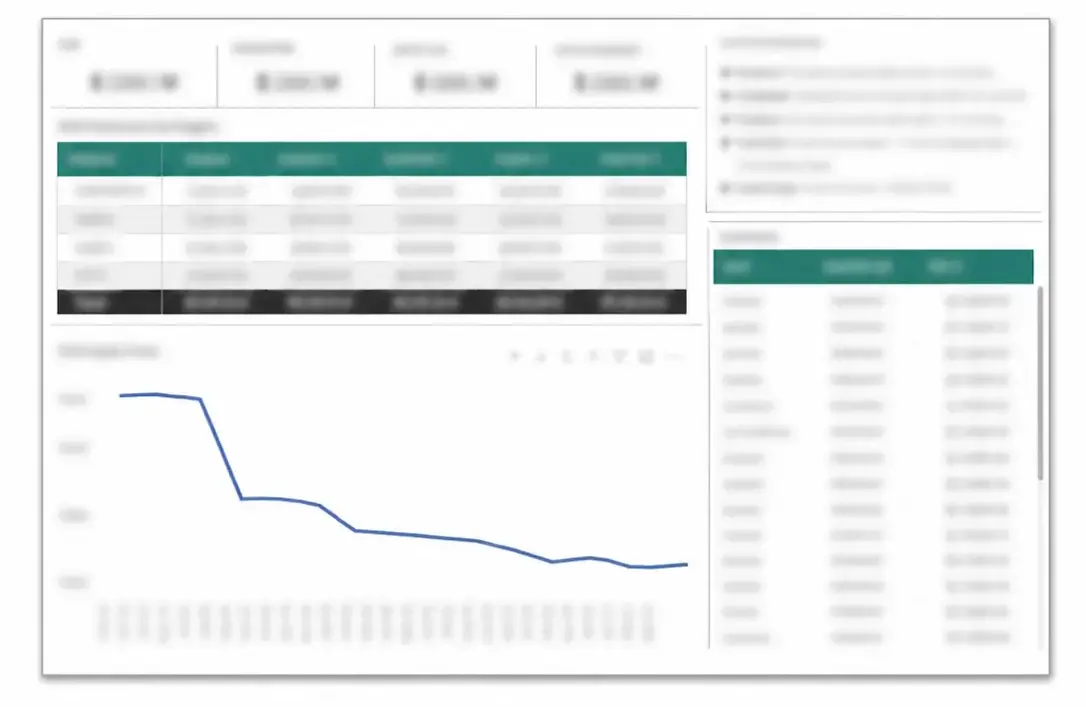
Daily monitoring provided better visibility into inventory values and guided buyer behavior back to pre-pandemic protocols.